1. Dashboard Configuration
the Configuration panel enables you to customize the overall layout and display properties when you create or edit a dashboard. The main configuration items are as follows:
- name: Set the name of the dashboard for easy identification and management.
- Enable: After checking, the dashboard will participate in the system carousel display and can automatically switch between multiple dashboards.
- Card height: Set the height of all cards in the dashboard uniformly. Note: A single Dashboard supports only one card height type.
- Number of columns: Define the number of cards displayed per line and support flexible layout adjustment.
- Container: Select the background style of the card and provide a variety of visual styles to adapt to different scenes.
- Border: Customize the border style of the card to improve the aesthetics and readability of the interface.
[Tip] After changing the layout configuration, the added components will automatically adapt to the new row, column and size rules.
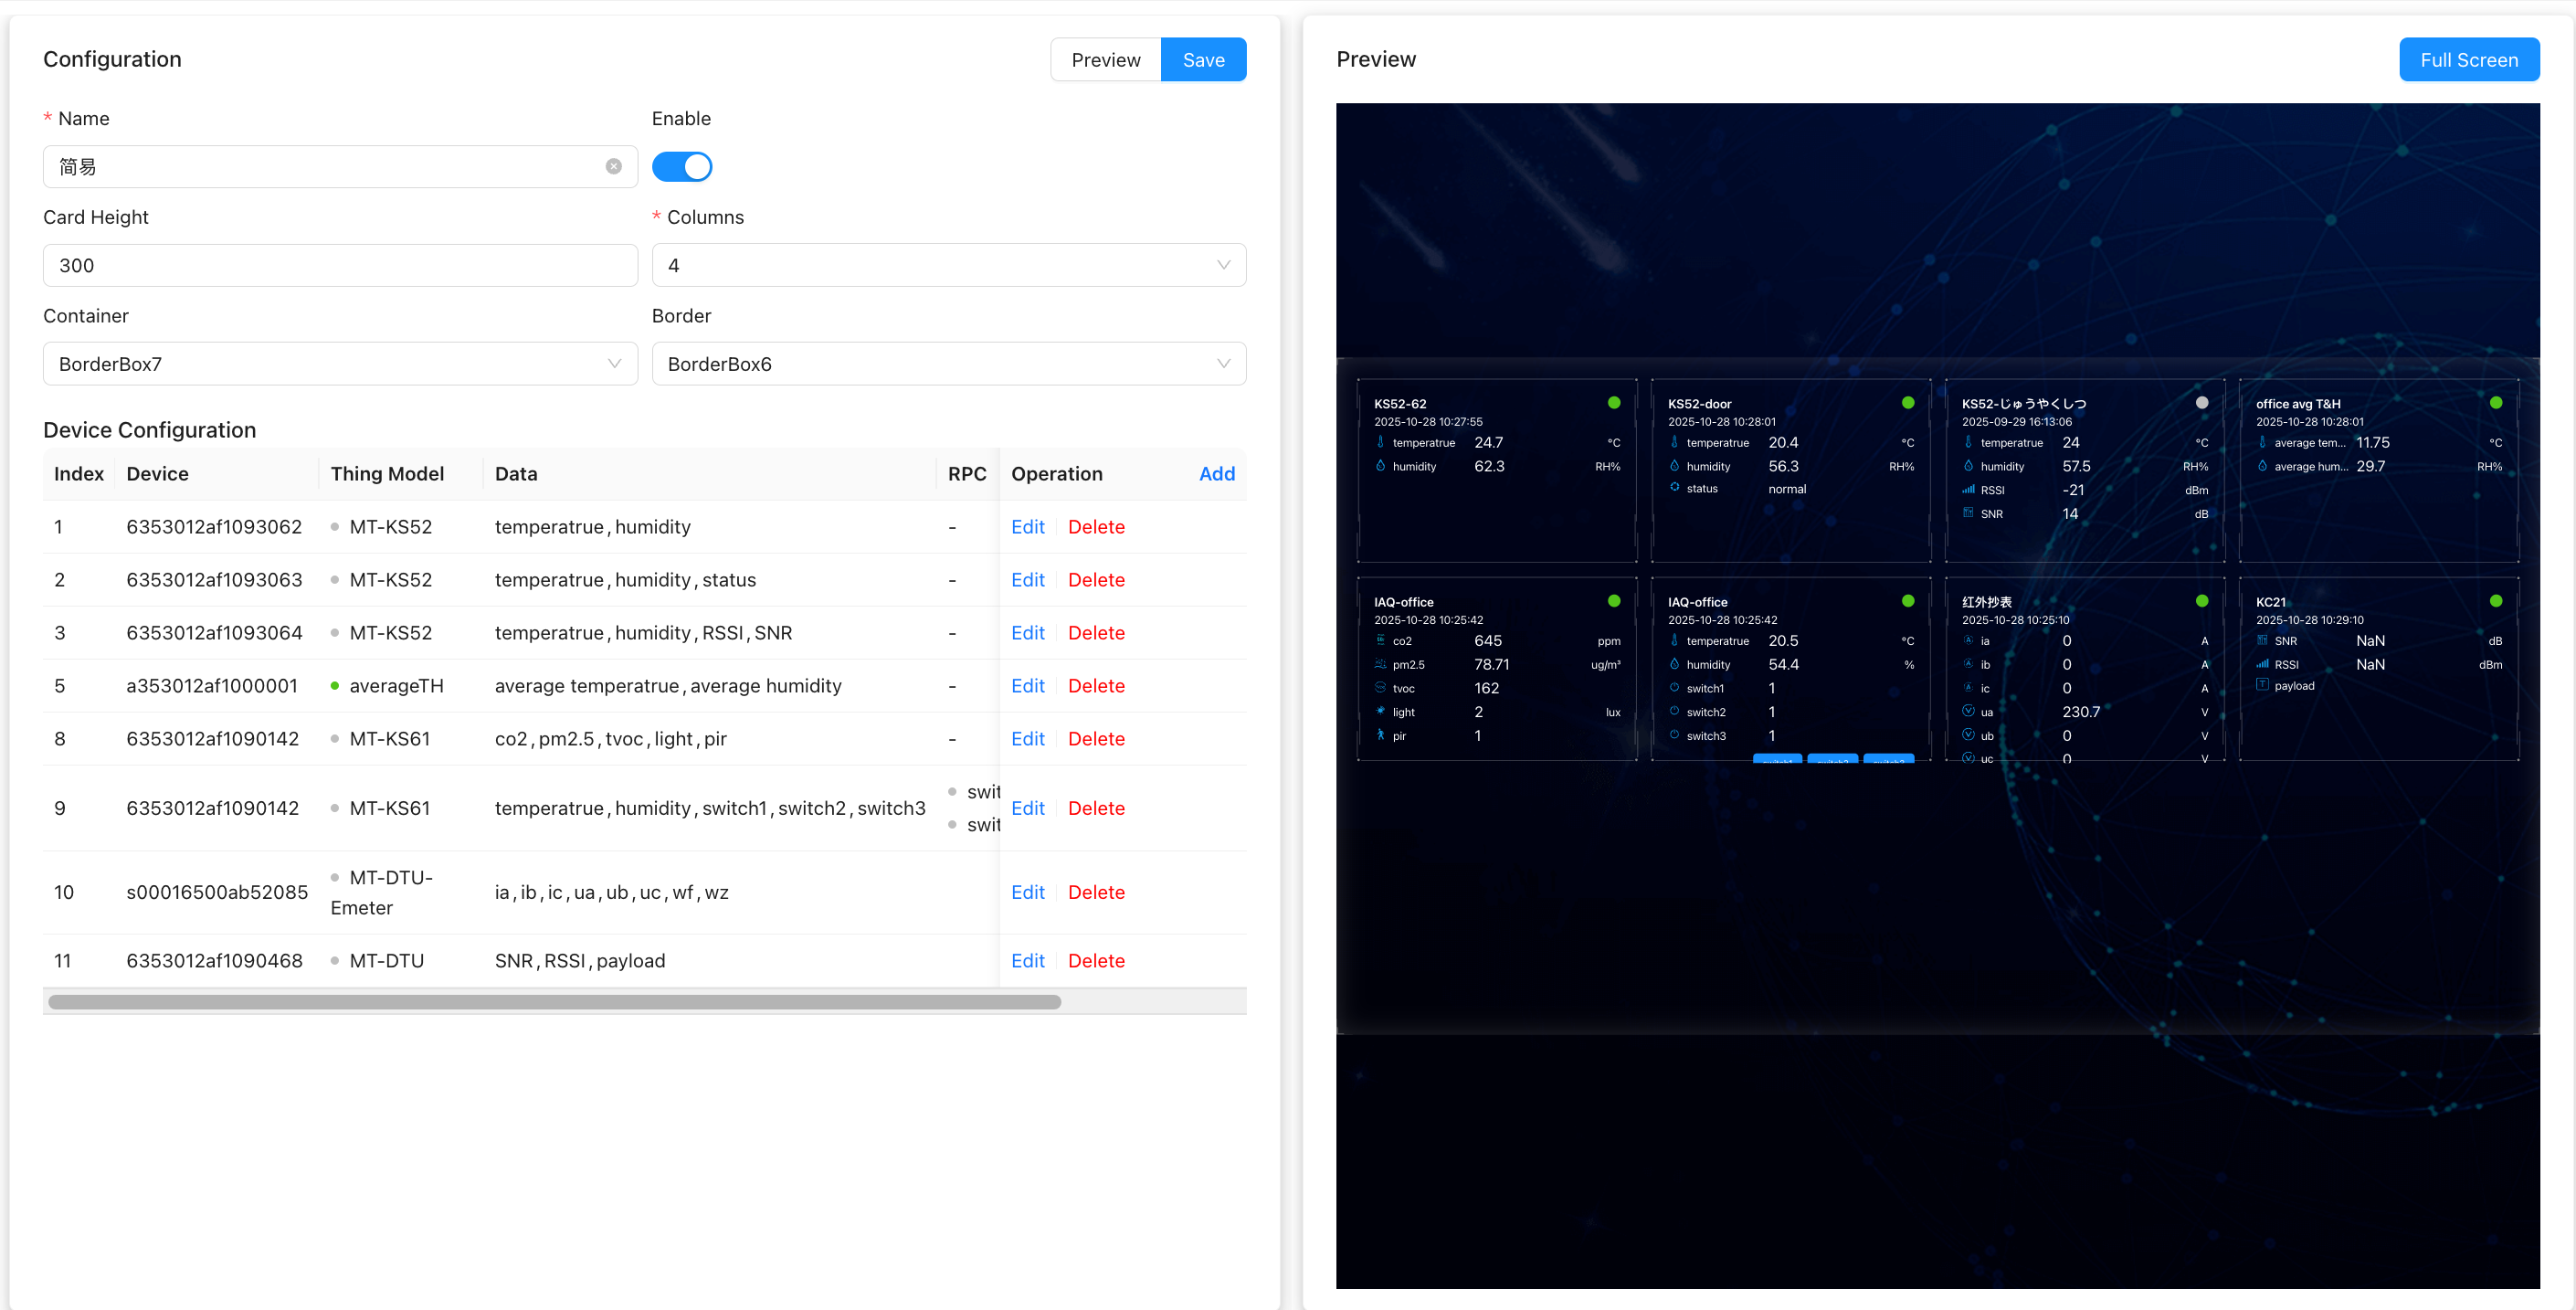
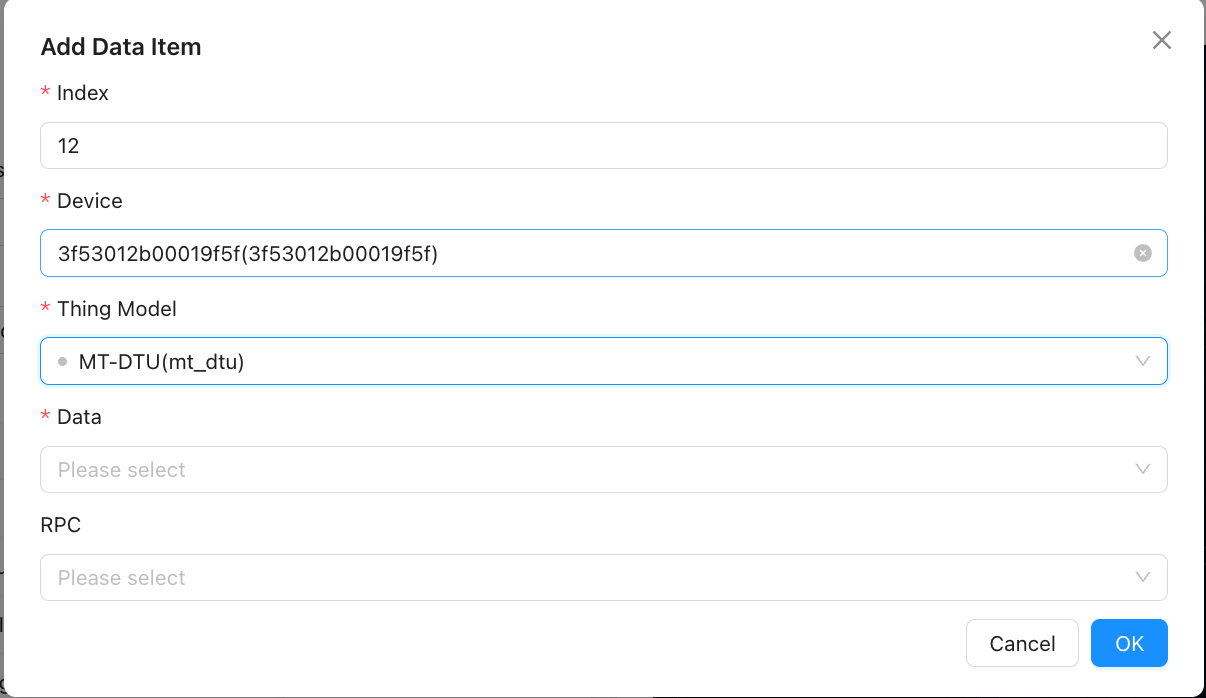
1.1. Device Card Configuration
by clicking the Add button, you can add device data cards to the current dashboard for visual display of key data.
- Serial Number: Set the display order of the data item in the card list. The smaller the value, the higher the priority and the higher the display.
- Thing Model: Select the thing model category (such as temperature and humidity sensor, smart meter, etc.) to which the target device belongs to determine the data structure and parsing rules.
- Equipment under the selected model, further specify the specific equipment instance.
- Data: Select the data fields to be displayed (such as temperature, humidity, power, etc.) from the selected device.
- RPC: Select the RPC operation enabled below the card
[Note] Support to add multiple device cards, each card independent configuration and real-time data refresh.
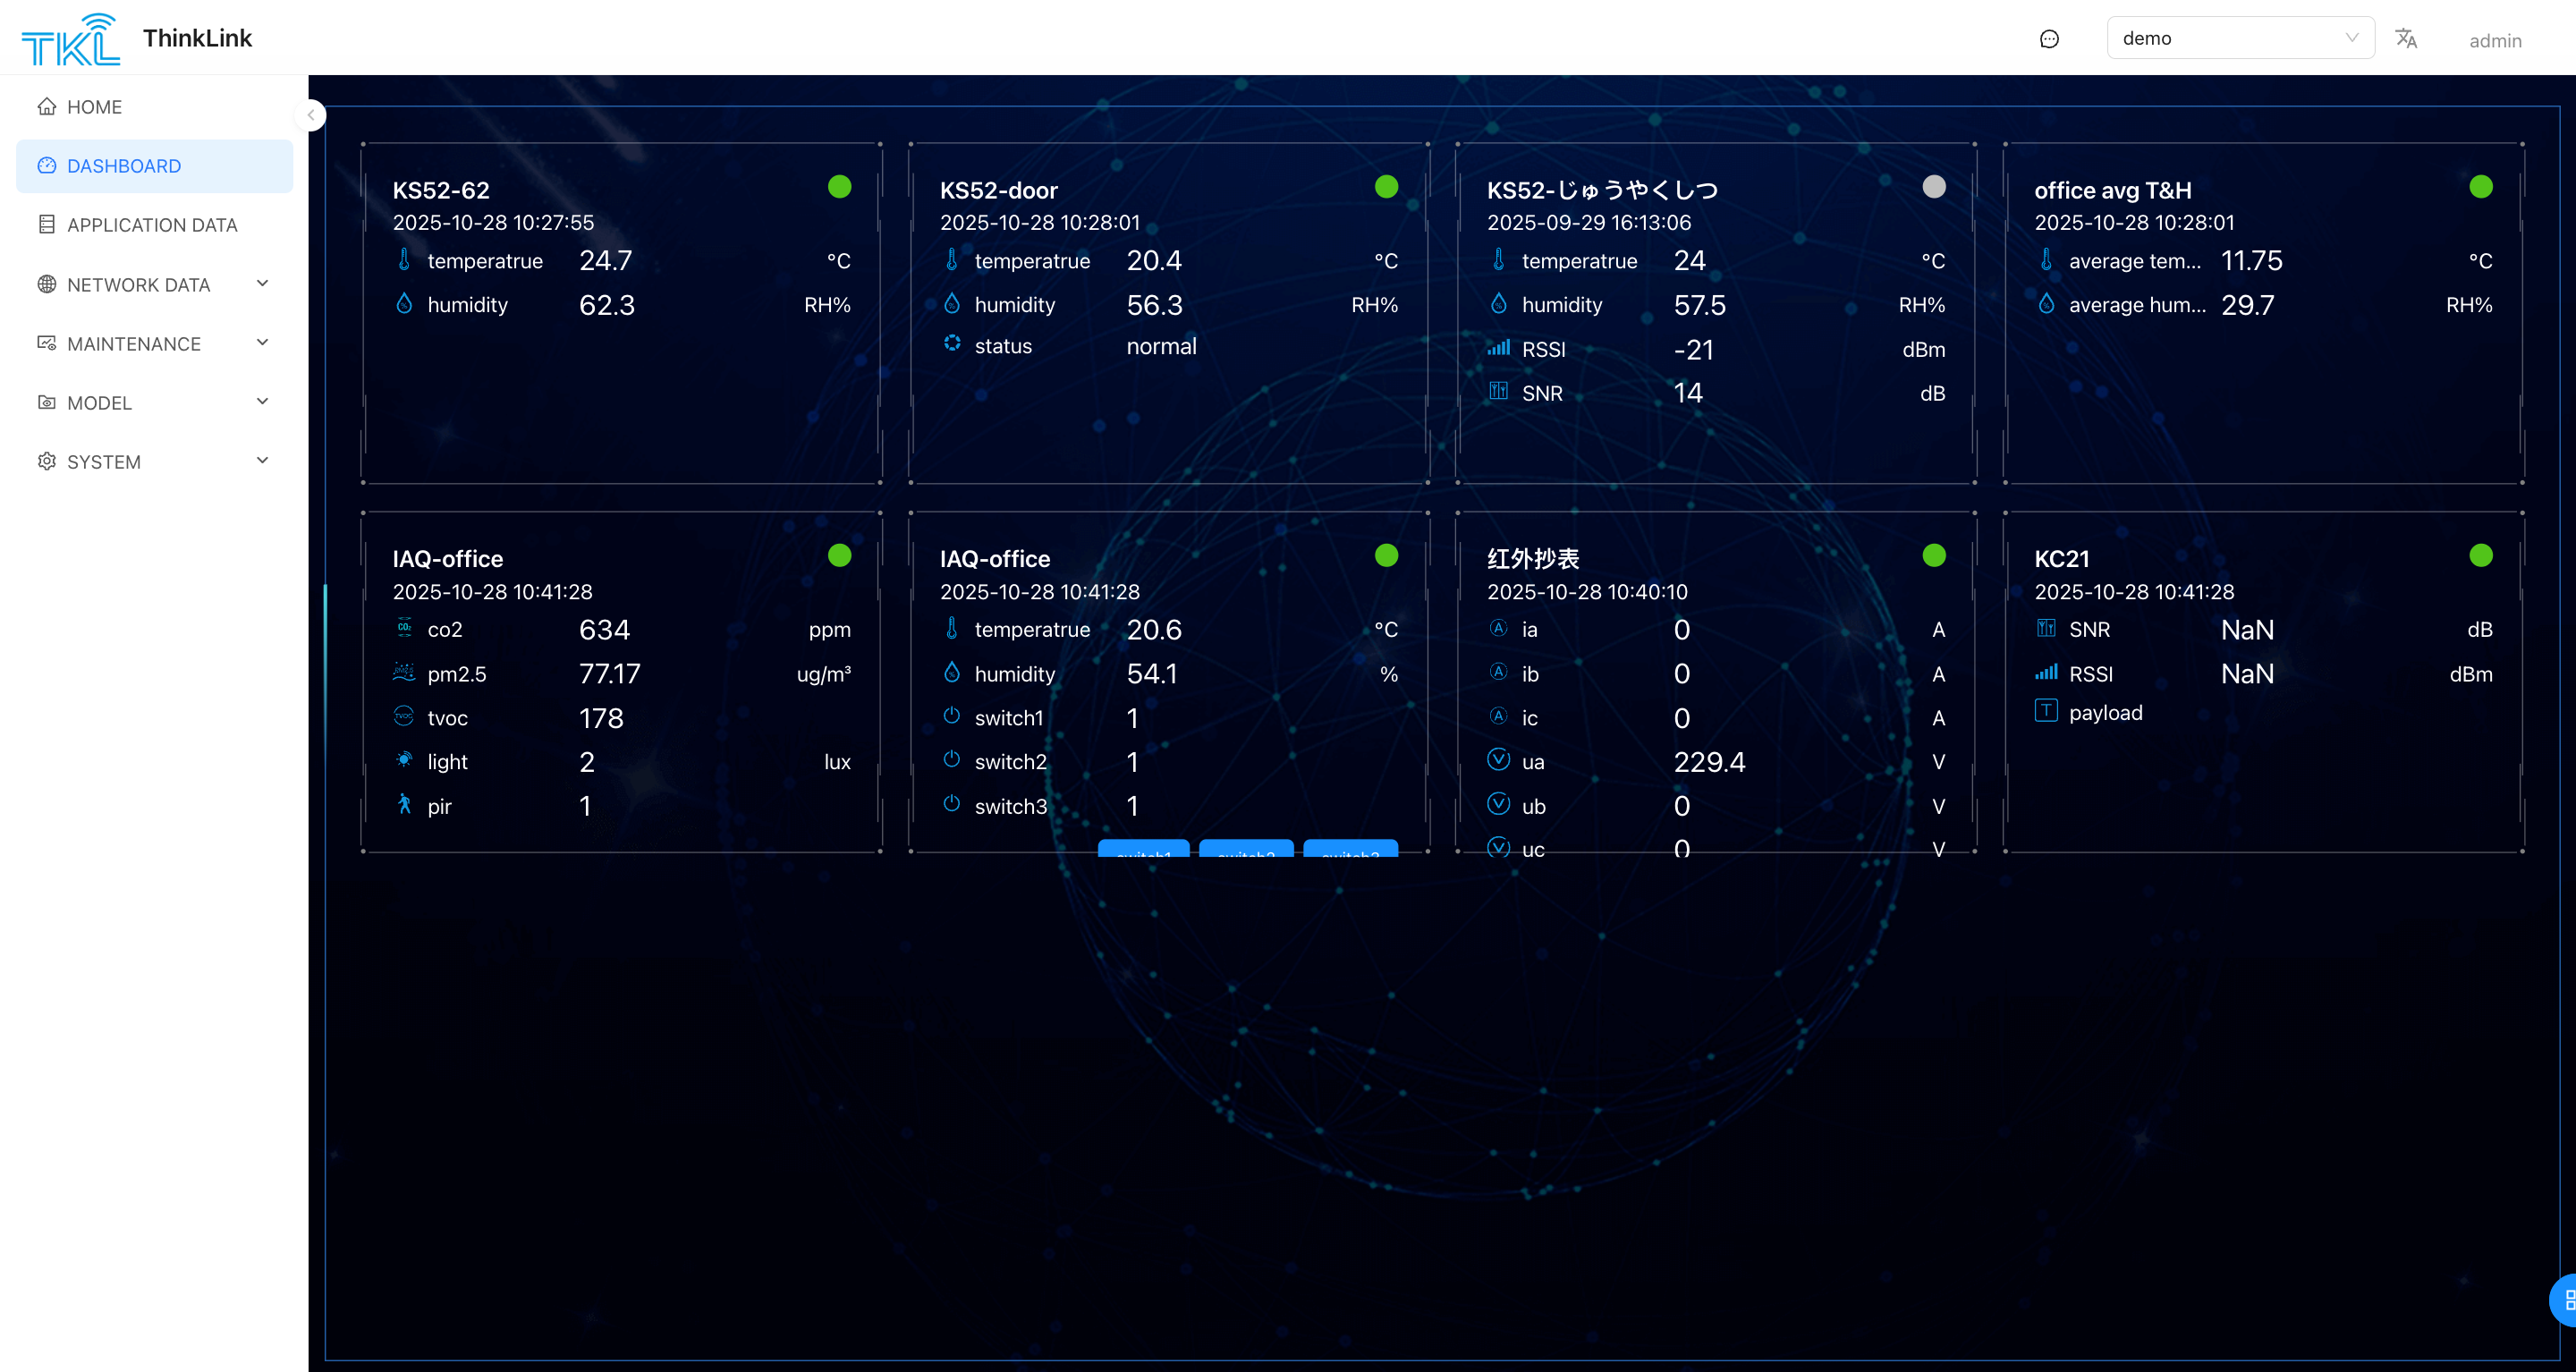
1.2. View Dashboard
enter the left side menu of the system [instrument panel] page, you can view all configured dashboards.
- All dashboards marked as "enabled" will automatically participate in Carousel playback, which is suitable for large screen monitoring scenarios.
- Click full Screen button, which can be displayed in full-screen mode for on-site demonstration or centralized monitoring.
The following is the content of the "thing model" chapter you provided, and the optimized instruction manual format. The text description is more clear and professional, and retains the original technical details and structural logic, which is convenient for users to understand and consult.